| crime.files |
| |
 |
|

| crime.features |
| |
 |
|

| crime.resources |
| |
 |
|

| crime.co.nz |
| |
 |
|


|
 |  |

Administrative offences
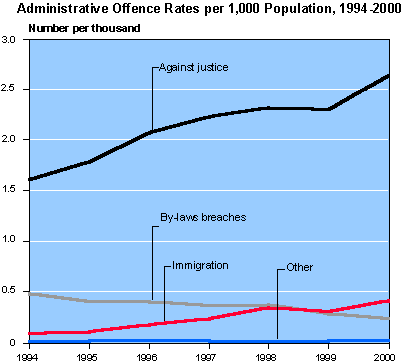
From 1994 to 2000, administrative offences increased by about 50 percent to 3.3 per 1,000 population. The increased rate of offences against justice seen in figure 14 underpins much of the overall increase in this crime category. The offence rate for this class of offence increased by 65 percent over the period investigated.
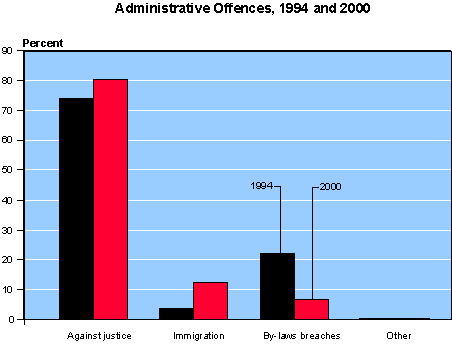
Offences against justice include offences against judicial offices or judicial procedures, offences after sentencing, failure to answer bail, police complaints, and breaches of miscellaneous statutes such as the Motor Vehicle Dealers Act and the Fair Trading Act. Births, deaths and marriages offences, racial offences, and offences against national interest are combined into the 'other' class in figures 14 and 15 due to small numbers in these offence classes.
Figure 14

From 1994 to 2000, there was an increase in the resolution rates for immigration offences and by-laws breaches. Immigration offences had a resolution rate of 96 percent in 2000, while by-laws breaches had a resolution rate of 88 percent in 2000. The resolution rate for offences against justice remained steady at about 85 percent and there was fluctuation in the resolution rate for the 'other' class. The fluctuation is due to the small numbers of offences that fall into this category, with the result that each resolution has a significant impact on the resolution rate.
While only 4 percent of all administrative offences in 1994 were immigration related, this figure rose to 12 percent in 2000. The increase in the number of immigration offences may be partly due to recent changes in immigration policies determining who is eligible to immigrate. Changing numbers of immigrants to New Zealand can also affect immigration related offences.
The immigration offence rate per 1,000 population increased four-fold over the period, but remained relatively low at 0.4 offences per 1,000 population in 2000.
In contrast, the offence rate for by-laws breaches halved between 1994 and 2000. In 1994 by-laws breaches constituted 22 percent of all administrative offences, but by 2000 this had dropped to 7 percent. This decrease may be due to the abolition of various council by-laws.
Figure 15

|
 |
|

Three percent of all offences recorded in 2000 were classified as administrative offences. |
|